For the first time since the lockout-shortened 2012-13 season, Carey Price has been struggling to stop pucks for an extended period of time. Since December 1, he has an abysmal .893 save percentage, before which he was stopping a stellar 94.6 per cent of shots.
While both numbers look extreme, the high was only 1.5 percentage points higher than his average over the past three seasons, while the low is 3.8 percentage points lower. Price has mentioned that the combination of playing in the World Cup of Hockey and the compressed schedule has him fatigued, but it’s unlikely that accounts for such an extreme change.
In scouting Price’s saves and goals against over this period it looks to me like his lateral movement is a bit sloppier than usual, which could tie in with the second observation; his puck tracking seems to be suffering a bit.
In order to figure out what’s gone wrong, I want to focus specifically on even strength play and from there we can break down what has changed for Price.
Let’s start with his save percentage by zone prior to Dec. 1.
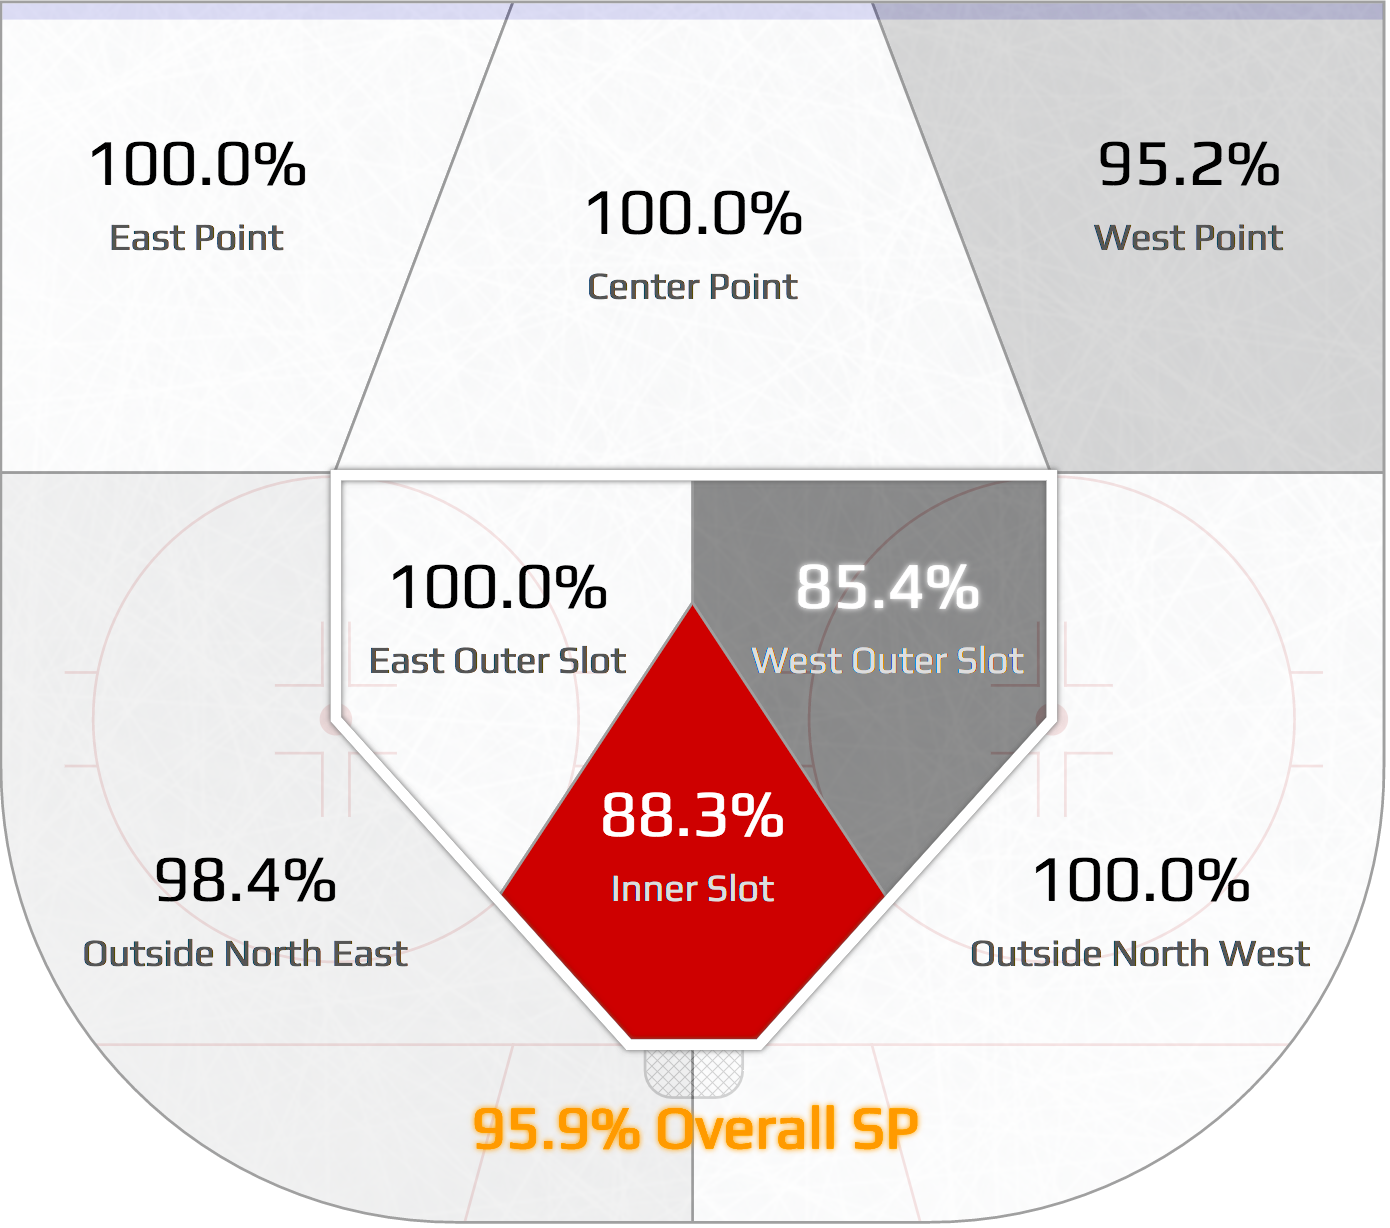
In the first two months of the season, Price had easily the highest inner slot save percentage in the league, 11.1 percentage points higher than league average. And he was strong just about everywhere else as well, aside from the west outer slot, where he was one goal below average.
But how does this chart look since Dec. 1?
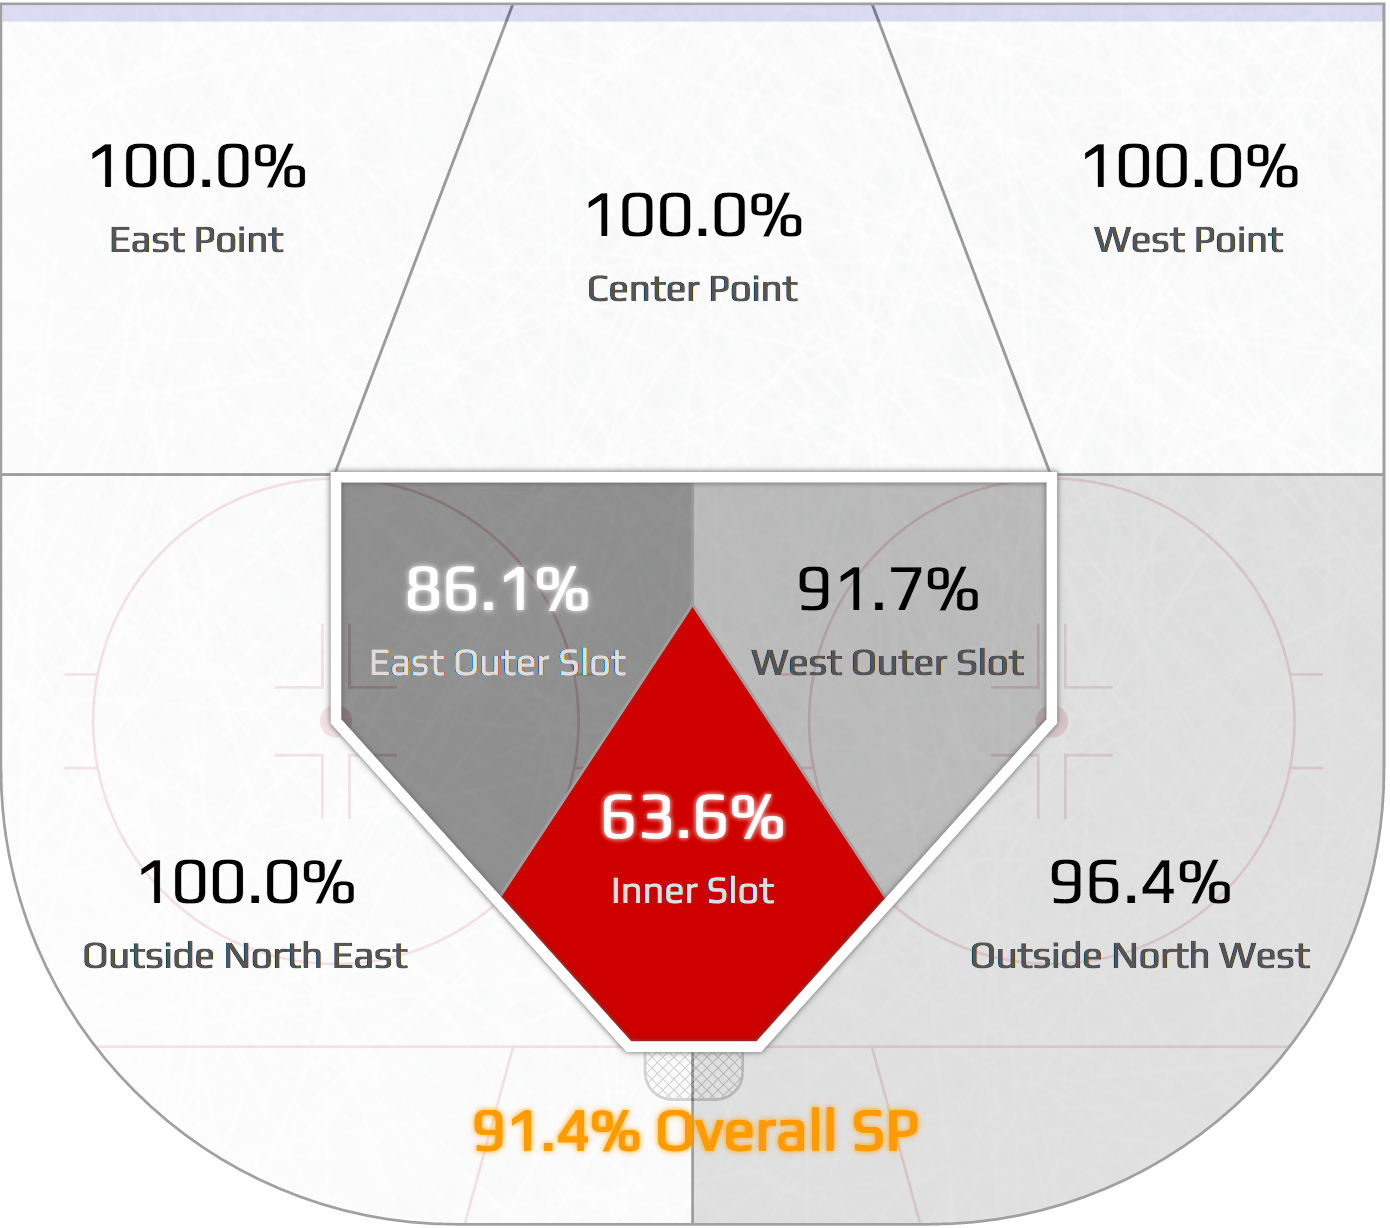
Outside the slot, Price has been essentially perfect, while in the outer slot he’s still above league average. However, inside the high danger zone or inner slot, he’s gone from 11.1 percentage points above average to 13.6 percentage points below average. That is a shocking turn of events, but it does isolate his troubles to one specific zone.
If Price is struggling only in the inner slot, we have to wonder how much of it is his own doing so let’s look at where he’s putting rebounds, again looking at his pre-Dec. 1 totals first.
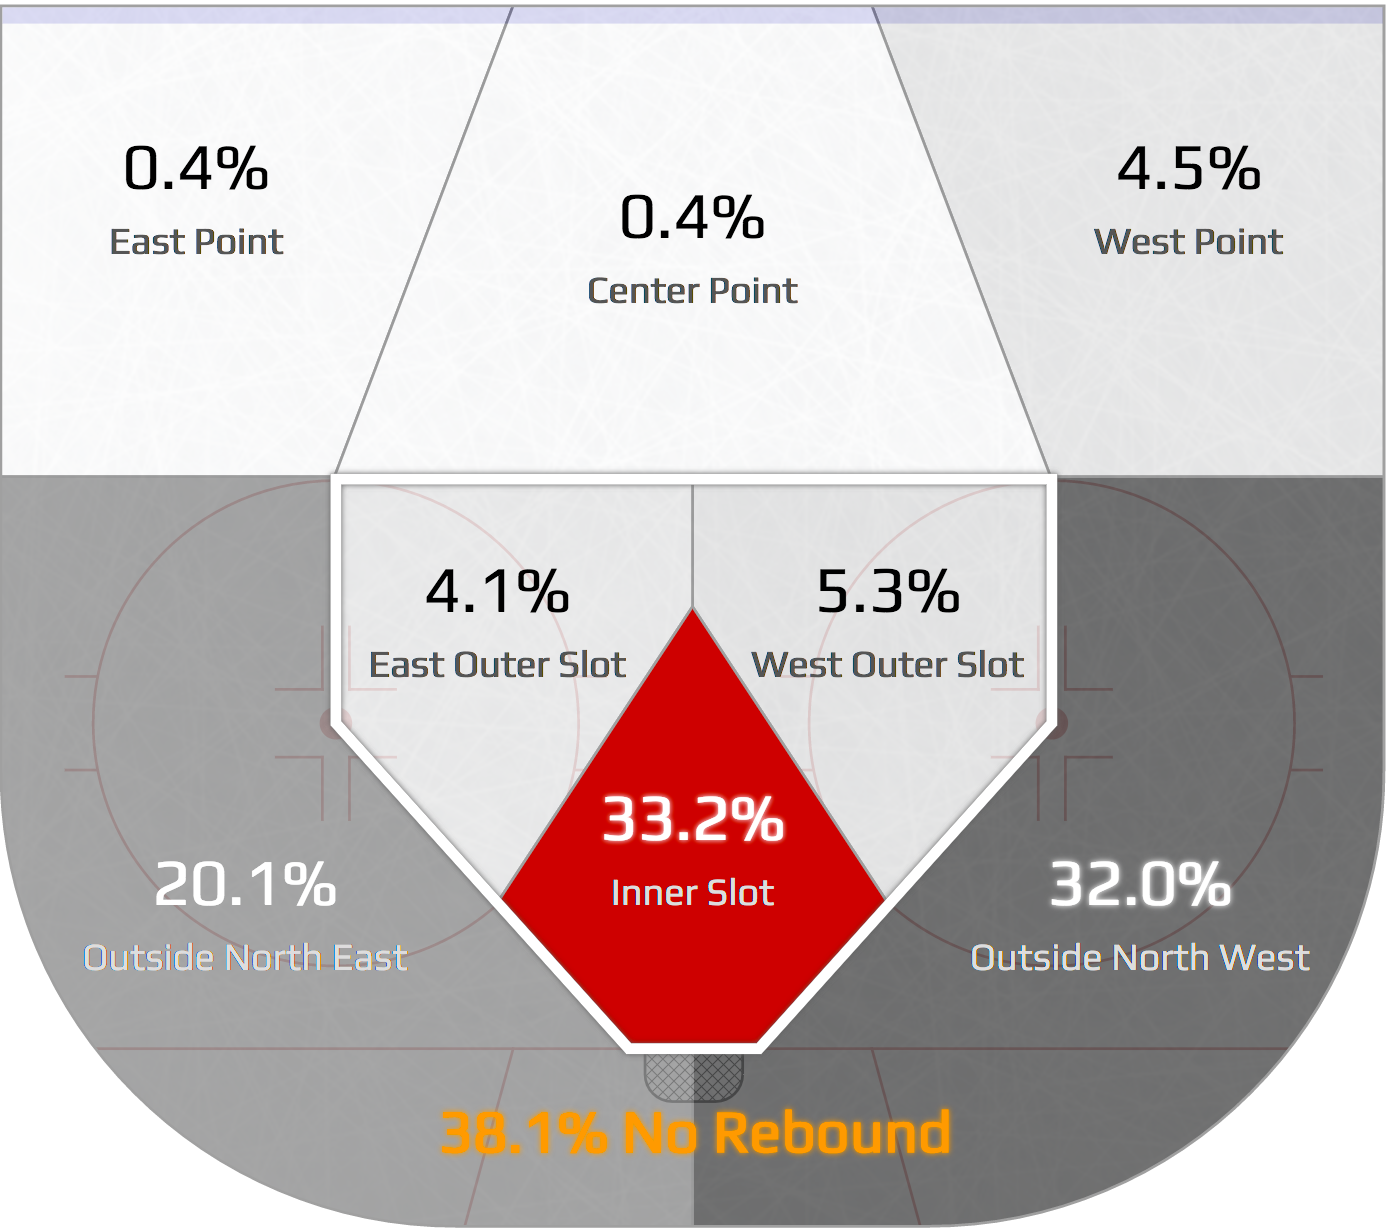
While Price was dominant, only 38.1 per cent of shots on goal produced no rebound, while 52.1 per cent of rebounds went into the corners and 33.2 per cent went to the high danger area. If that’s our baseline for him, let’s look at where his rebounds have ended up since Dec 1.
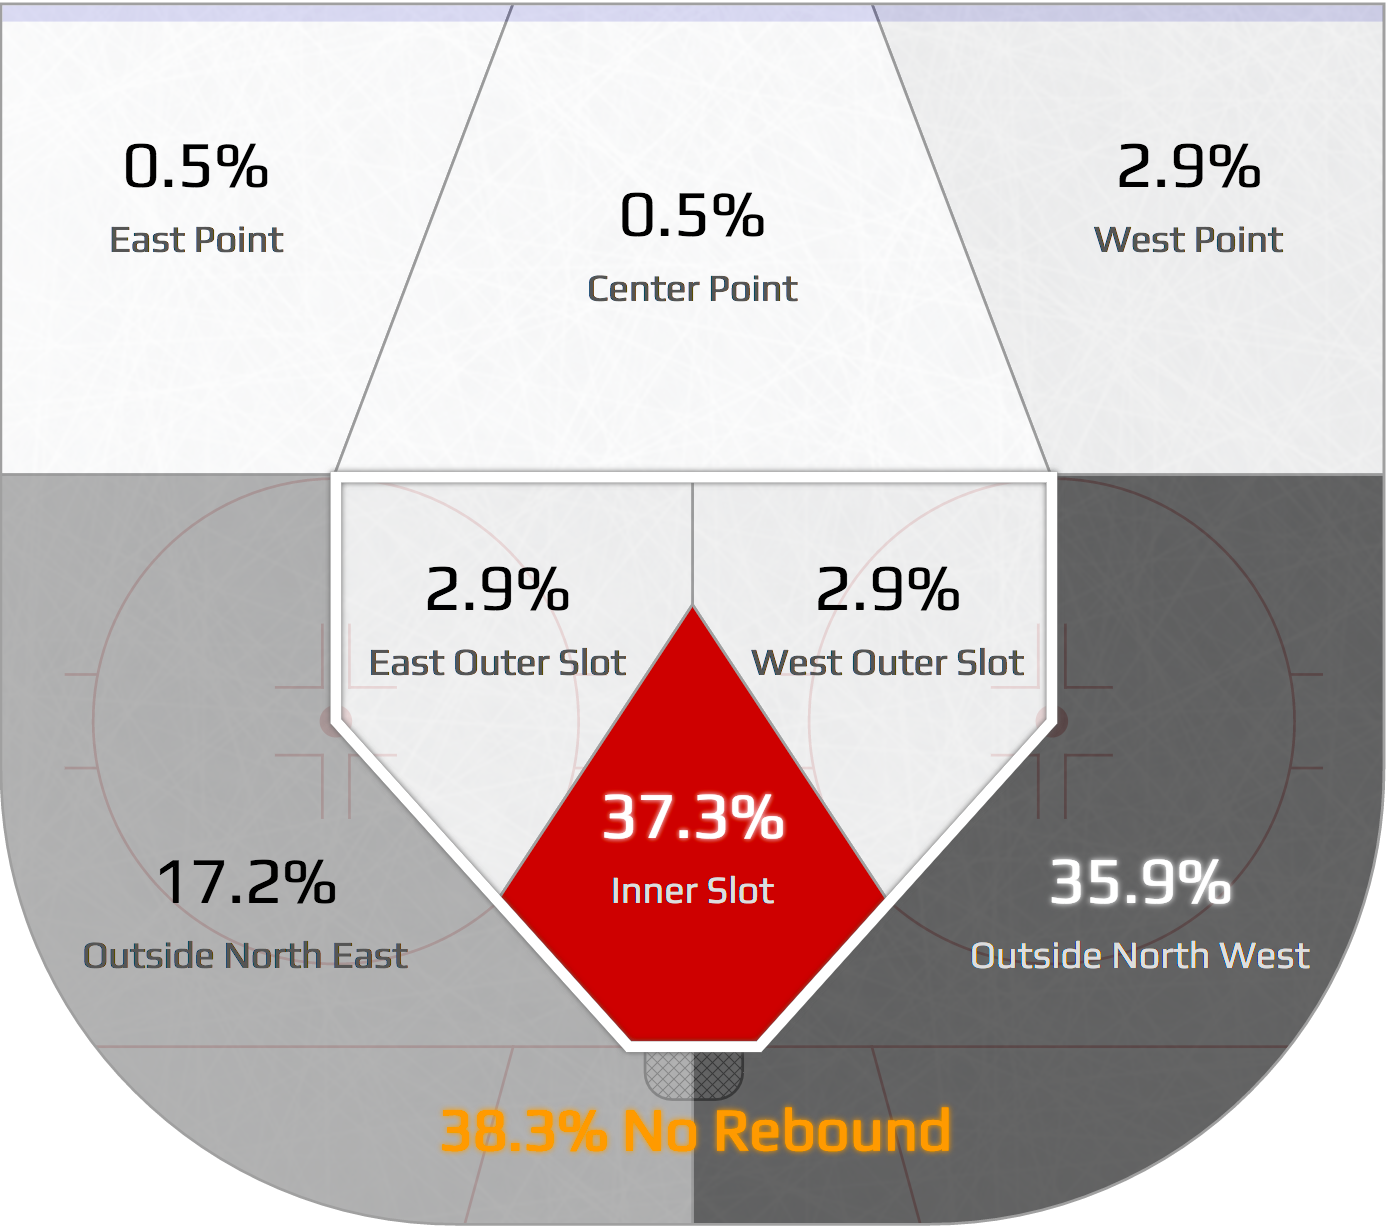
Price has actually been allowing slightly fewer rebounds, with 38.3 per cent of shots on goal producing no rebound at all. But the most dangerous rebounds to the inner slot are up by 4.1 percentage points — 3.6 of those 4.1 percentage points have come inward from the outer slot, but no matter how you slice it Price has been giving up more dangerous rebounds since Dec. 1 than he was before.
The next question is how much his defencemen have been victimized on those rebounds, so we need to look at the percentage of rebounds that were recovered either by Price or the rest of the Montreal Canadiens.
Let’s start by looking at the first two months of the season. These graphics represent the percentage of times the Habs recovered the rebound in a certain area and recoveries are defined as simply getting the puck, not clearing the zone.
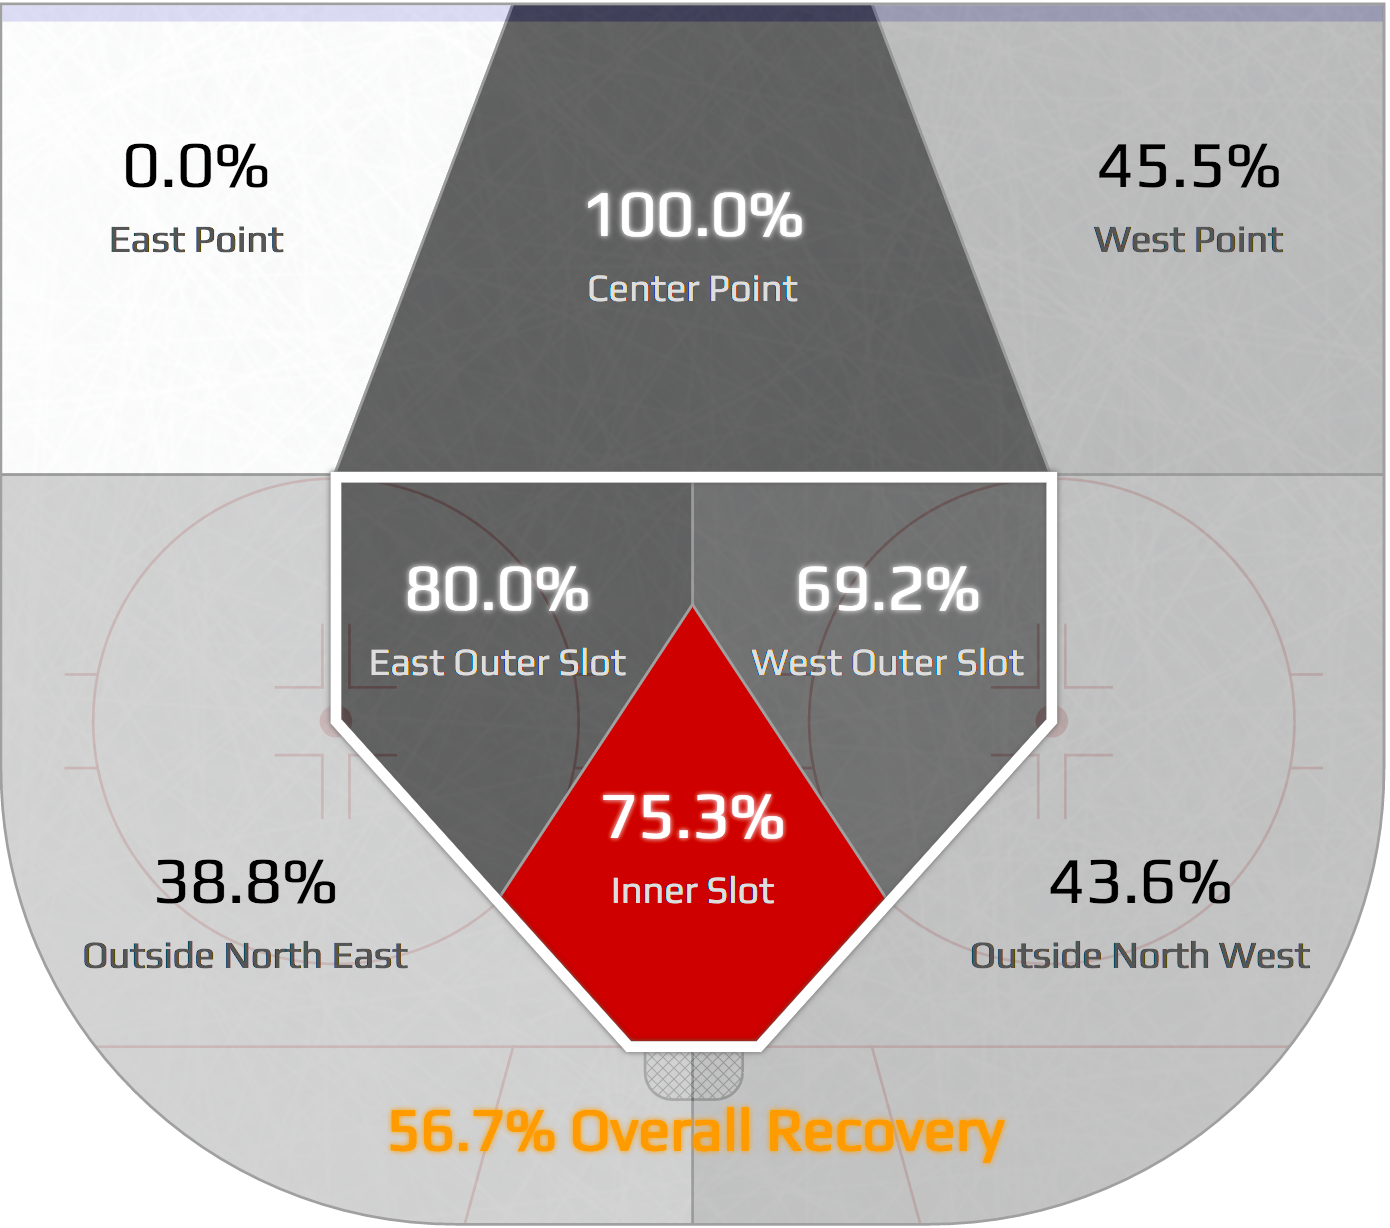
The Canadiens are a strong team in terms of recovering rebounds, but in the first two months of the season there was a significant weakness on the right side in the slot, and on the left side along the boards, but how about since Dec. 1?
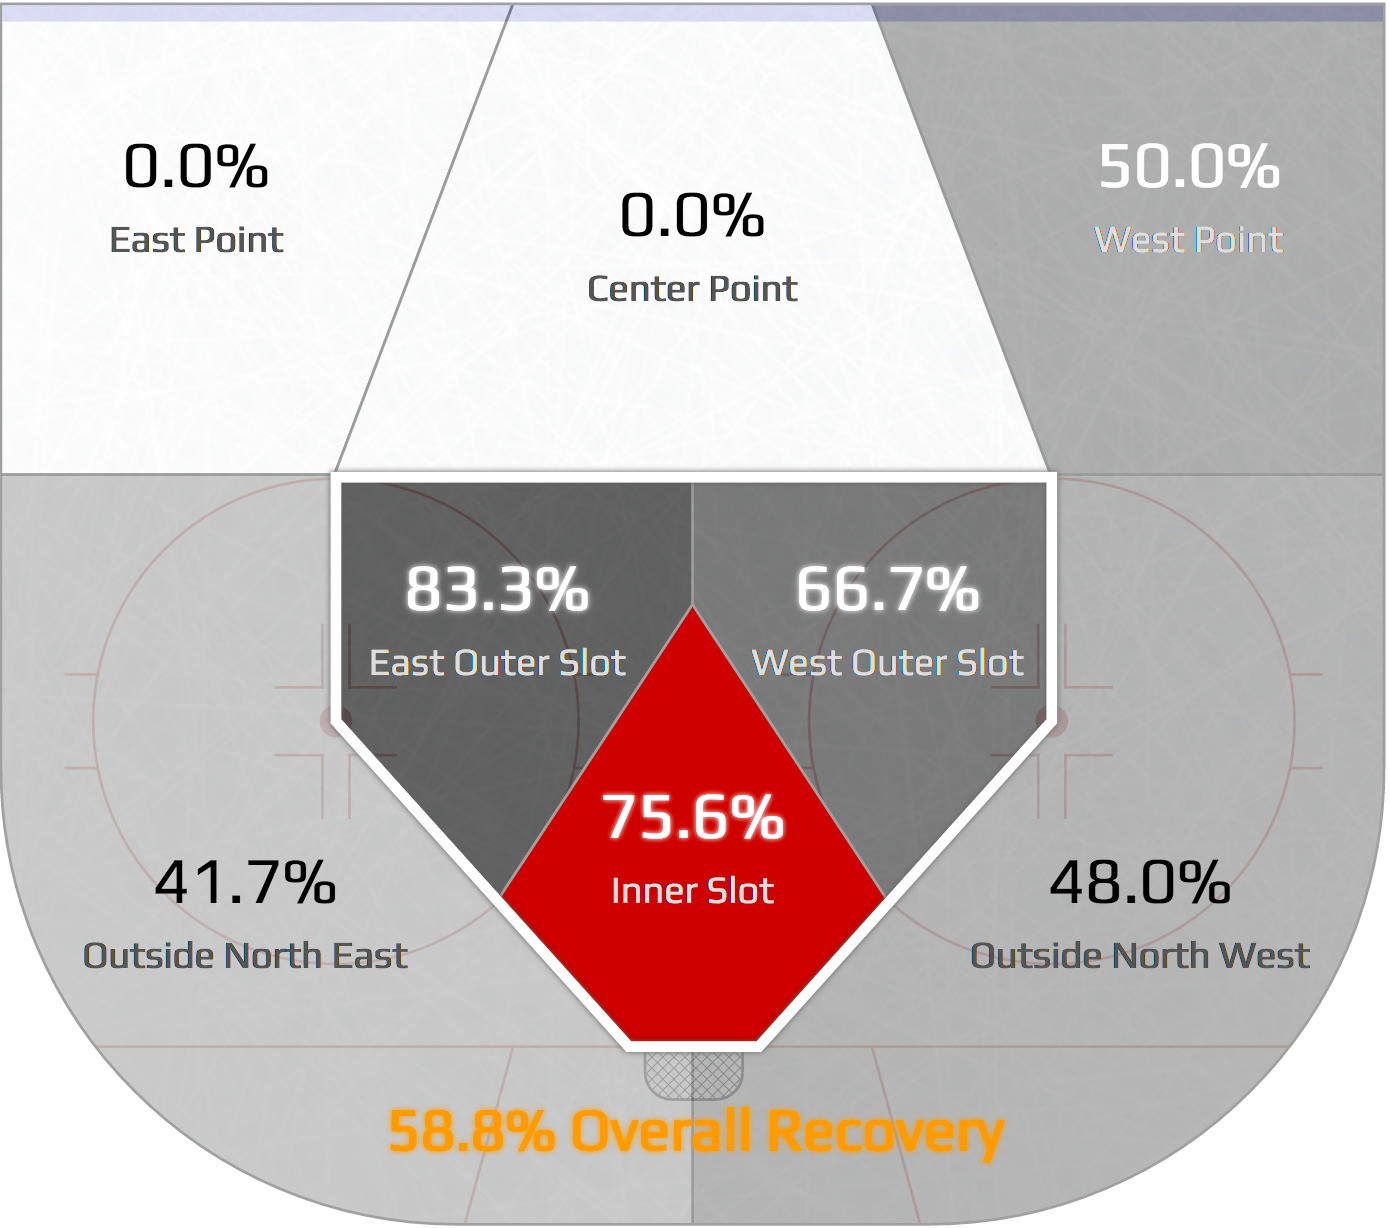
The Canadiens have actually been better at recovering rebounds since Dec. 1, though the same zonal weaknesses exist. We can assume that rebound goals, if there are a lot of them, are more Price’s fault than the players in front of him.
Looking at every goal Price has let in at even strength since Dec. 1, what stuck out to me was how high the quality of goals were. Of the 29 even strength goals he has allowed in that time, only one looked like a soft goal so I broke down the factors of difficulty on the goals he let in. Keep in mind that a single goal can have more than one difficulty factor.
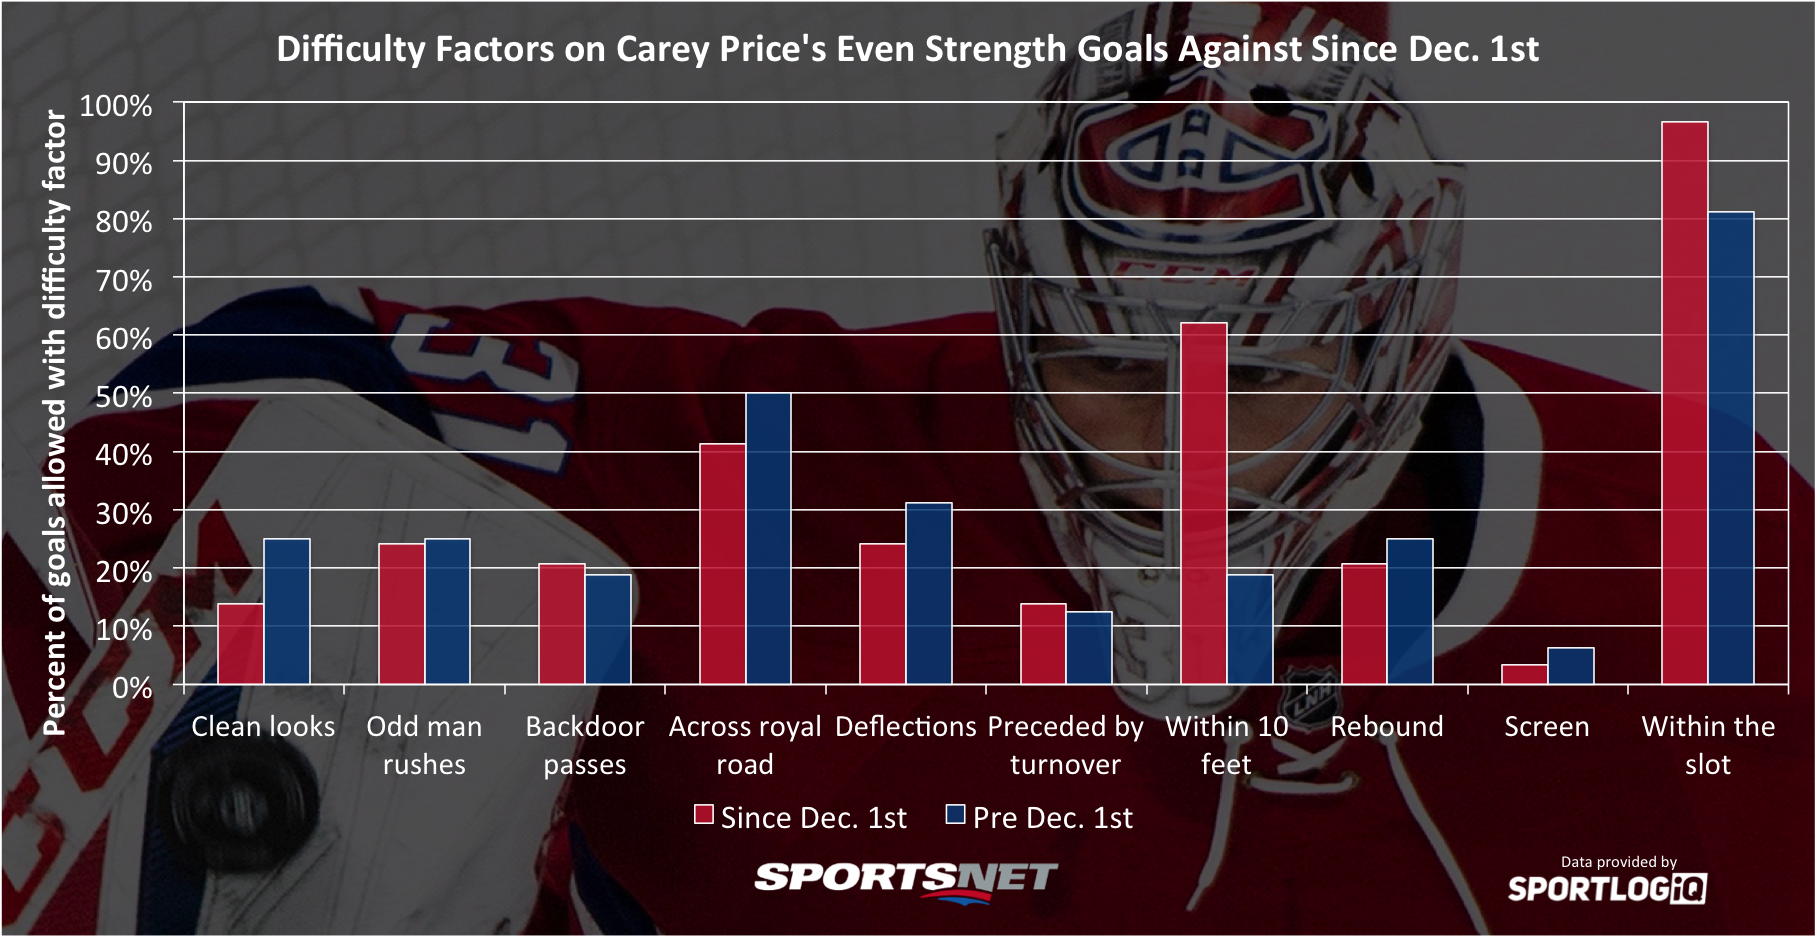
The first thing that stuck out to me about the goals Price has allowed during this cold streak is that only one of them was outside the slot — and that was a backdoor pass to a one-timer from Tyler Johnson.
Another thing that stuck out was that he was allowing fewer goals on clean looks than earlier in the season, which are unscreened shots that were not immediately preceded by a pass – shots Price could get set up for. Three of the four goals he allowed on clean looks were off the rush, with the other being an odd-looking wraparound.
The biggest takeaway in all this though is how often Price is being scored on from within 10 feet, or essentially around the lip of the crease. Over the past six weeks and change the Canadiens have been absolutely dominated near their own goaltender, allowing tons of unchecked shots from the worst area on the ice.
None of these factors combine to say Price has actually been great through his struggles. He has undeniably not been his normal self, but the combination of a rough stretch for him and for the team’s defence is what has produced those ghastly numbers.
Ironically, the Canadiens have actually been allowing fewer even strength scoring chances against since Dec. 1 than they were before, but the chances they’ve allowed are of much higher quality.
Until the Habs can sort out their defensive issues, it will be all on Price to rebound under pressure. Luckily for him and the team, the offence has been doing their job effectively this whole time.