An early storyline of the 2014 playoffs has been the struggles of goaltender Jonathan Quick. The Kings have stumbled against the Sharks and Quick has given up 16 goals through three playoff games. For a goaltender who forged his reputation during a 2012 Cup run and Conn Smythe-winning performance highlighted by athletic, fan-friendly saves, fans might be confused as to why Quick’s clutch gene malfunctions.
He is a fun goaltender to watch because he plays like his hair is on fire…
…and when he is supported defensively he is an impact player, but left unsupported his style can lead to major blowups. And ultimately, Quick’s reputation exceeds his save percentage. It is the final category in which a goaltender’s greatness is generally judged and with an elite number Quick would solidify his reputation among the best in the world.

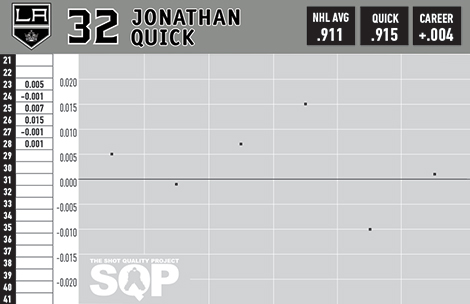
Although Quick’s .915 career save percentage is above the NHL average, it puts him in the same statistical middle class as James Reimer (.914), Craig Anderson (.915) and Mike Smith (.915). The problem is if we isolate his numbers against his goaltending partners during his Kings career they register a .914—a difference of .001.
Seeing as this is the shot quality project, I am open to a defence of Quick based around him being exposed to more difficult shots. My research has uncovered goaltenders who have been exposed to higher-quality opportunities who compare favourably if we normalize the results. I don’t have a full database for Quick, but of the 1,600 Kings shots I have tracked, L.A. falls on the side of slightly above average in limiting Quick’s exposure to high quality opportunities.

Success in the offensive zone is predicated on lateral offensive movement. Good teams move opposing goaltenders out of position and exploit passing lanes. A goaltender’s best defence against that is taking an efficient route to the puck. Quick’s struggles are generally his own creation. Like Tim Thomas, he is super aggressive and tends to guess and over commit. When that happens he chases the play and finds himself scrambling for recoveries.
I am forever intrigued by the way baseball and basketball continue to push the technical boundaries of what is possible to measure. Based on the trajectory, speed and arc of a batted ball, baseball has recently produced a graphic that shows routes taken to the ball compared to the optimal path. Basically, it is now possible to decipher the best possible route to the ball from a fielder’s starting point.
Like outfielders, there are optimal routes a goaltender can take to square up the shooter and remain ahead of the play. When goaltenders take sub-optimal routes due to lack of speed, poor tracking or just poor paths, they can be badly exposed without proper defensive support. We can’t yet decipher a goalie’s best path to the puck, and with our eye tests being open to bias, we can miss these flags if the end result is positive because of strong defensive coverage. If a shot never comes or a miraculous save is made, poor routes can be replaced by “he battles” comments.
To illustrate this I tracked Quick to see how effective his crease containment was and how often he took sub-optimal routes based on his aggressive depths and tendency to gamble.
![Quick_Depth-470[1]](http://assets1.sportsnet.ca/wp-content/uploads/2014/04/Quick_Depth-4701.jpg)
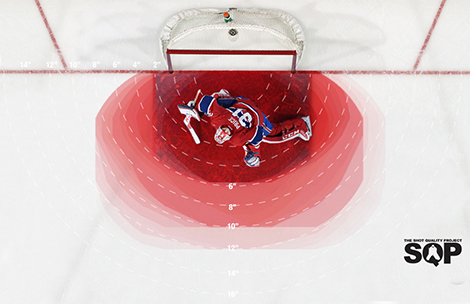
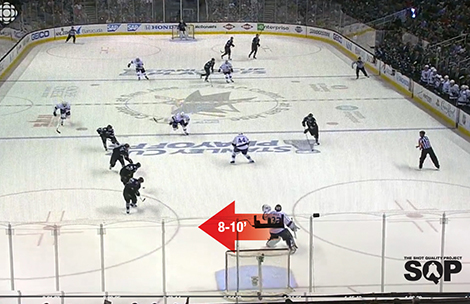
Quick is comfortable outside of his crease, often cutting down his angle up to 10 feet outside the blue paint. That does provide strong net coverage if the shot lacks any lateral movement, but the minute the puck starts going side to side, the routes he takes become longer and net coverage becomes more difficult. Considering how dangerous the SQP determined the lateral pass to be, Quick’s aggressiveness is not sustainable on a poor defensive team.
For some context, I also tracked a similarly numbered event game for Carey Price (51-53 Corsi events). He is not extreme like Henrik Lundqvist, but is pretty close to the goalie coach blueprint in regards to depth and efficient route creation.
Price rarely wanders further than four to five feet from his crease. That means shorter recovery routes on rebounds and lateral feeds.

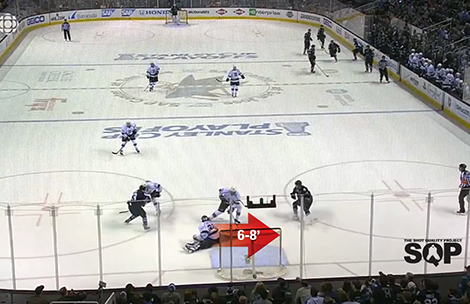
Whereas Price’s route may require five to six feet, Quick puts himself in a position where he needs to recover with eight-to-ten foot routes.

Quick is four-to-six feet above the paint even with the lateral backside danger in play. When the backside recovery becomes a reality, Quick immediately shifts into desperation mode.

If his depth is a more manageable one-to-two feet above the crease, he allows himself plenty of time to read the lateral feed and power stride into position. His route speed will be maximized because he maintains his feet, which allows him the chance to make a desperation backside recovery of three-to-four feet if a second lateral event occurs. Quick’s initial depth decision created a cascade of secondary decisions that moved outside optimal-route efficiency and ultimately ended up in a goal. It’s too simple to consider this a “no chance” or “nothing he could do” goal. This is an aspect of the game that is rarely covered when explaining the goaltending position and the simple mental decisions that result in goals.
During the single-game samples I studied, Quick needed to travel 114 feet more than Price to get into his positions. That is a major problem if your defence cannot compensate for your aggression—and it was exposed last season when Quick’s save percentage was only .533 on lateral feeds.
Stopping pucks has become a mathematical problem based on probabilities, routes and speed. There will always be an efficient route and proper decision regardless of the goaltender. With proper tracking technology we will be able to create efficient scenarios that highlight goaltenders who excel in defensive independent scenarios. Until then, guys like Quick will only be exposed when placed in sub-optimal conditions like the first two games against the Sharks.
The problem early in the series isn’t really Quick, it is the Kings’ defensive failure to insulate him from high-leverage situations.
