With the addition of free-agent centre John Tavares, the Toronto Maple Leafs now boast one of the deepest forward groups in the league.
But defensive zone concerns remain.
In 2017-18, the Leafs allowed the fifth-most shot attempts in the league at five-on-five. They also finished 27th in expected goals allowed (xGA). More on “expected” statistics later. If the Leafs are to make the leap from playoff team to serious Cup contender this season, they will have to improve play in their own end and prevent more pucks from going in the direction of their net.
In addition to luck, there are two other ways to keep the puck out of your net: reduce the quality and volume of the other team’s shots against, and have your goalie stop more of the shots that do land on net.
This off-season, the Leafs made no significant changes to their defensive corps. Other than the extra defensive help that should come from better depth down the middle, there is not much reason to expect Toronto’s skaters to be better in their own end.
[snippet ID=3322139]
If that holds true, the only other way the Leafs could prevent more pucks from going into the net is with better goaltending. In this article, we’ll dive into Frederik Andersen’s advanced metrics over the past two seasons and ask: Has Andersen hit a ceiling, or is there still room for him to improve?
Over the past two seasons, Andersen has played a total of 132 regular season games, an even 66 in each season. Over that time, he has faced more shots than any other NHL goaltender and the only goalie with more games played is Edmonton’s Cam Talbot.
Traditional statistics don’t always do a good job of evaluating how an individual goaltender impacts a team’s defence. Stats such as goals-against average and save percentage don’t tell you how much credit (or blame) should go to the skaters, and how much should go to the goalies.
Traditional save percentage, for example, doesn’t account for the quality of shots the goalie faces. This stat treats a dump-in from the far blue-line the same as an Alex Ovechkin one-timer on the power-play. Obviously, one of these saves is not like the other.
Fortunately for hockey fans, the analytics community has developed statistics that provide us with a more accurate idea of a goaltender’s individual contribution. Today we’ll focus on two of these: delta save percentage (dSv%) and goals saved above average (GSAA).
Delta save percentage (dSv%), provided by Corsica Hockey, improves on save percentage by taking into account shot quality, and not just quantity. It’s a measurement of how well a given NHL goalie stacks up against a league-average goalie. To calculate a goalie’s dSv%, you subtract that goalie’s expected save percentage (xSv%), from their actual save percentage. Expected save percentage is a measurement of how a league-average goalie would perform if they had faced the same shots as the goalie being analyzed.
It takes into account a few different factors in order to provide an expected save percentage based on the quality of shots against:
• Shot type (slap shot, wrist shot, etc.)
• Shot distance
• Shot angle
• Whether the shot was a rebound, rush shot, or on the power play
Each individual shot is rated according to these criteria. A positive dSv% means a goalie performed better than the average goalie would have done if they had faced the same shots, while a negative dSv% indicates the opposite. So, if a goaltender had a save percentage that was one per cent higher than what we could expect of a league-average goalie in his situation, then he would have a +1.0 dSv%.
By using dSv%, we can get a better sense of the quality of shots Andersen has been stopping. Among goaltenders who played a minimum of 1,500 minutes over the past two seasons, Andersen ranks 43rd out of 60 xSv% at 91.02 per cent. In 60th place is Cam Talbot at 90.55 xSv%. This means that when you account for shot quality, a league-average goalie would be expected to save 91.02 per cent of shots on goal if they had played in Andersen’s place. A lower xSv% means that a goalie’s skaters are allowing opposing teams to take higher quality shots.
Andersen’s low-ranked xSv% means that in addition to facing the most shots in league, the shots he has been facing have also been much harder to save than those faced by most other goalies. This is still true if you refine the data to only display starting goaltenders. Out of goaltenders who played at least 4,500 minutes over the past two seasons, Andersen ranks 23rd out of 32 in xSv%.
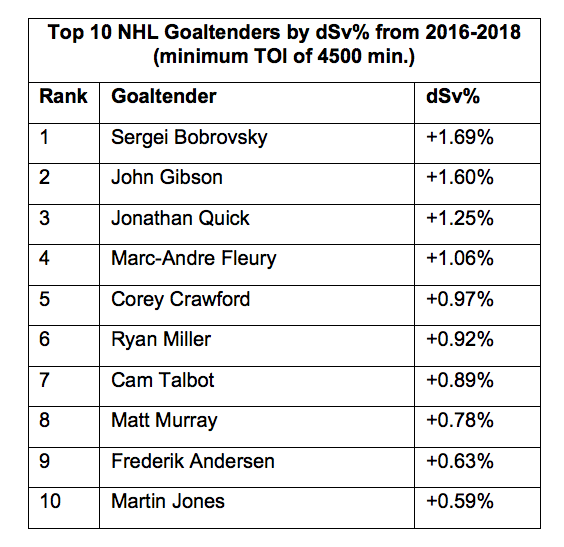
Despite this, Andersen has played excellent hockey. Over the past two seasons, among the 32 goalies who played at least 4,500 minutes, Andersen’s dSv% was +0.63 per cent, good for ninth in the league. This means his save percentage was 0.63 per cent better than what a league-average goalie’s would have been, had the average goalie faced the same quality of shots that Andersen did.
For reference, here are the top 10 goaltenders by dSv%:

To put into context how significant 0.63 per cent is, the difference between the fourth-best save percentage in the league and the 11th best was just 0.6 per cent — .917 to .911. Given how close these stats are to each other, you can see how your goalie being 0.63 per cent better than league-average can be the difference between a championship team and a team on the playoff bubble.
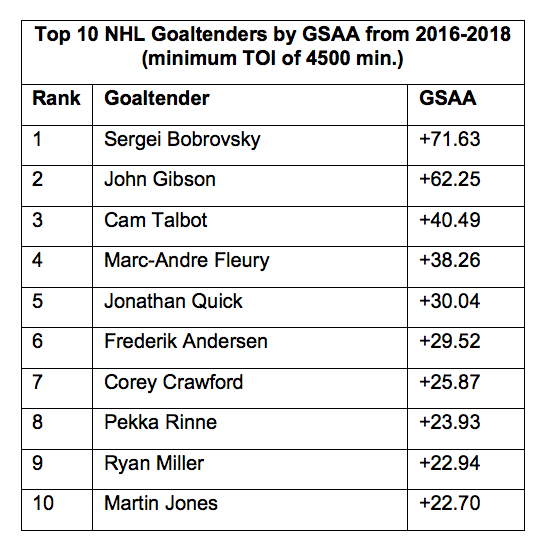
As for the other statistic, goals saved above average (GSAA), it complements dSv% by incorporating shot volume. Essentially, GSAA tells you how many goals Andersen saved the team in comparison to a league-average goaltender. Over the past two seasons among the 32 goalies who played at least 4,500 minutes, Andersen ranked sixth in GSAA with +29.52. The Leafs goalie prevented 29.52 goals that a league-average goaltender would have allowed in the same situation over that two-year span. Once again, here are the top 10 in that category:
These stats leave no doubt that Andersen is an elite NHL goaltender, but there is still room for him to improve. Andersen is still a full percentage behind the league leader, Sergei Bobrovsky of Columbus, in dSv%. Because Andersen faces a league-leading volume of shots, even a minimal increase in dSv% over the course of a season would result in a significant increase in GSAA.
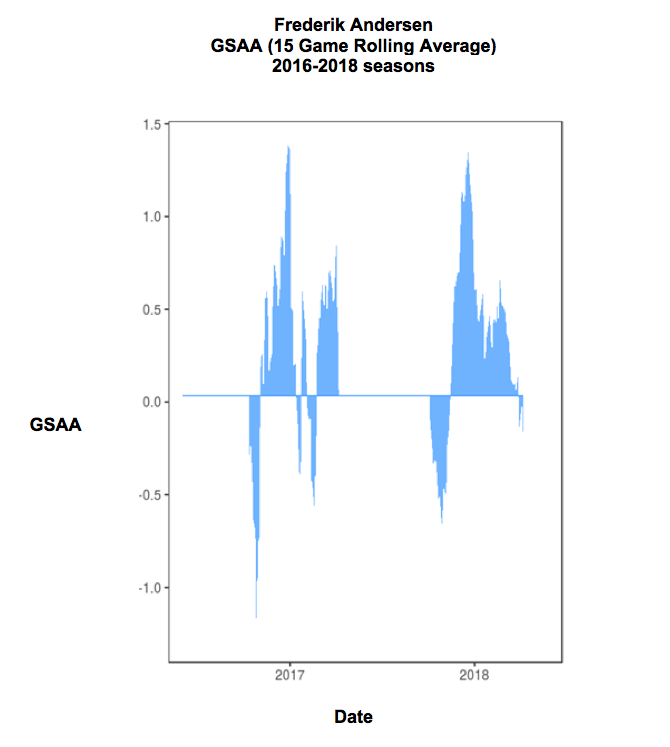
You also can’t help but consider the impacts of Andersen’s brutal workload. One wonders if he might be even better if he were able to rest more and play less games. The following chart shows Andersen’s GSAA from the past two seasons (including playoffs) as a rolling average of his previous 15 games. Here, the 15-game rolling average provides the average GSAA that a goalie had in the previous 15 games. With every additional game, the 15th oldest game is dropped from the average, and the newest game is added to it.
The data demonstrates that Andersen routinely gets off to a slow start, posting a negative GSAA during the beginning of each season. He then peaks near mid-year, with both of his highest GSAA around the beginning of each new year on the calendar. And as the season wears on, he declines. In 2016-17, he had a resurgence at the end of the season and into the playoffs. In 2017-18, his play began to consistently deteriorate.
While we can’t determine with certainty that Andersen’s play worsened specifically because he was overplayed, the end-of-season decline suggests there could be something there. And it’s possible there may be other benefits in providing Andersen with extra rest near the end of the season.
With workloads like Andersen’s, goalies can become increasingly injury-prone. One example that comes to mind is former Carolina Hurricanes goaltender Cam Ward. While he was roughly the same age as Andersen is now, he played a whopping 74 games in 2010-11 and 68 games in 2011-12. Over those seasons he ranked eighth in dSv% among goalies with at least 4500 minutes, with +0.54 per cent.
In 2012-13, he suffered a lower body injury that took him out for nearly the entire season. Since returning from that injury, Ward’s play has decreased significantly. From 2013-2018, he’s posted a -0.75 dSv%.
The Leafs had prime opportunities this past season to rest Andersen, yet did not do so. In the last two seasons, with the exception for when a goalie is pulled, Mike Babcock has almost exclusively saved his backup goalies for back-to-back games. For example, in 2016-17, the only game a backup started that wasn’t a back-to-back was when Curtis McElhinney started against Florida on March 28.
Last season, McElhinney only started two games that were not either the first or second leg of a back-to-back. These games were against non-playoff teams at the end of the season, on March 17 against Montreal, and April 2 against Buffalo.
As the regular season wound down, with the Leafs having the third spot in the Atlantic Division locked up, Andersen continued to play his usual intense minutes, and it’s not clear why.
This despite McElhinney finishing the past two seasons with a +0.98 dSv%, good for 11th overall among goalies who played at least 1,500 minutes. Over that time period, his 11.24 GSAA is also excellent for the reduced amount of shots he sees as a backup.
Even without the extra rest, Andersen’s statistics demonstrate that he is a high-calibre, regular season NHL goaltender, albeit with room for some improvement. The biggest challenge that remains for Andersen is to translate his regular season success into playoff success. If he can do this, the Leafs will have a much better chance at going deep into the post-season.
Raajan Aery is entering his final year of the J.D. program at Osgoode Hall Law School in Toronto. He spent part of this past summer as an intern with Sportsnet’s Business Affairs group. You can follow him on Twitter at @raajanaery.


