Last season we made efforts to project the offensive production for incoming top prospects such as Connor McDavid, Jack Eichel and Dylan Larkin. Overall, the predictions, which were based on analysis of past prospects who made the leap to the NHL directly from the CHL and NCAA, were relatively accurate:
| Player | Team | Projected Pts/GP | Actual Pts/GP |
|---|---|---|---|
| Connor McDavid | EDM | 0.98 | 1.07 |
| Jack Eichel | BUF | 0.68 | 0.69 |
| Dylan Larkin | DET | 0.58 | 0.56 |
| Zach Hyman | TOR | 0.26 | 0.38 |
| Jaccob Slavin | CAR | 0.29 | 0.32 |
| Blake Pietila | NJD | 0.33 | 0.29 |
| Noah Hanifin | CAR | 0.29 | 0.28 |
| Mike Rielly | MIN | 0.36 | 0.24 |
| Correlation between Projection and Actual | R2 = 0.935 |
Essentially by looking at players who came to the NHL right after being drafted, we can paint a relatively accurate picture of how some prospects are likely to perform.
Unfortunately for this year’s draft class, none of the prospects likely to leap directly to the NHL played in either the CHL or the NCAA. Auston Matthews, Patrik Laine and Jesse Puljujarvi all spent their most recent season playing pro in Switzerland and Finland. Thus if we want to project their performance we need to examine comparables in order to determine what to expect.
We took a look recently at how Matthews’ and Laine’s historical showings at the IIHF World Championship stacked up against former greats, and we came away with the conclusion that they are likely to perform at an elite level in the NHL quite soon. In order to project NHL performance, though, we probably could use a larger sample of information – and their most recent seasons in Europe are worth delving into.
Gabe Desjardins of BehindTheNet.ca first investigated NHL equivalencies in 2006 by building upon work done in baseball by Bill James as far back as 1985. The idea is that by averaging the performance of skaters who jump from one league to another we can estimate the relative performance of the inferior league. The numbers have since been maintained by Rob Vollman at www.hockeyabstract.com
This becomes more accurate when we have a larger sample of skaters making the leap from one league to another, so for instance with the AHL, the translation factor of 0.473 is robust because it is based on 764 skaters who played 20 games in both the AHL and NHL in consecutive seasons since 2004. Unfortunately, when we look at the Swiss League and Finnish Liiga, very few players (less than 20) have made the direct jump to the NHL so the average becomes less useful.
There are a few methods we can apply to improve our projections. For instance, all of the players included initially in the translation were players jumping directly into the NHL. We can add to the sample by including the seasons of players who have departed from the NHL and immediately gone on to play in the inferior league. Also – rather than using averages, we can actually look at the distribution of results and see if there are any patterns that may allow us to improve the accuracy of projections.
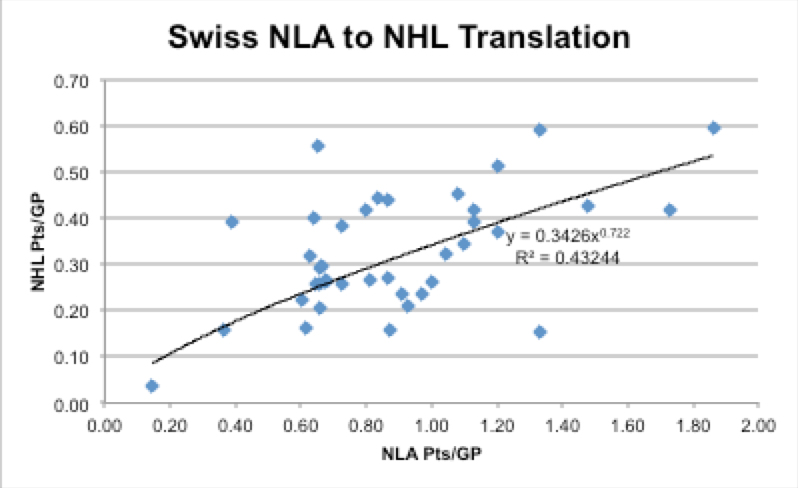
For instance, if we examine the distribution of Swiss League vs. NHL performance for skaters who made the jump overseas since 2000 and leave out the lockout seasons, we see a relatively consistent range of performance. Using the shown equation to project the performance of Auston Matthews we would conservatively translate his 1.27 points per game in the Swiss League to 0.41 points per game in the NHL.

However, it should be noted that virtually none of the skaters making the jump from Switzerland to the NHL directly did so after their first year of draft eligibility. Most were veterans well into their late 20s or even 30s, with the youngest skater in the sample being 22-year-old Roman Josi.
The reason this factor is relevant is the development rate of younger skaters causes significant increases in production. This wasn’t particularly necessary to account for in our CHL or NCAA analysis because the skaters included in the model were at a similar developmental stage of their career trajectory. Young prospects in junior have shown they can increase their production rates by as much as 25 per cent on average year over year. If we apply this to Matthews it would give us a projection of 0.51 points per game in his NHL rookie season next year.
This is nothing to scoff at, even though it’s lower than the production of McDavid, Eichel and Larkin in their rookie years. It would put him in close proximity to the rookie results posted by Rick Nash, Nikolaj Ehlers and Sam Reinhart (all 0.53 pts/gp) and match Marian Gaborik and Robbie Fabbri’s rookie production (0.51 pts/gp). It would also eclipse the production rates of Taylor Hall (0.50 pts/gp), Jakub Voracek (0.48 pts/gp) and Aleksander Barkov (0.44 pts/gp). This level of production is consistent with many top end offensive prospects in the NHL.
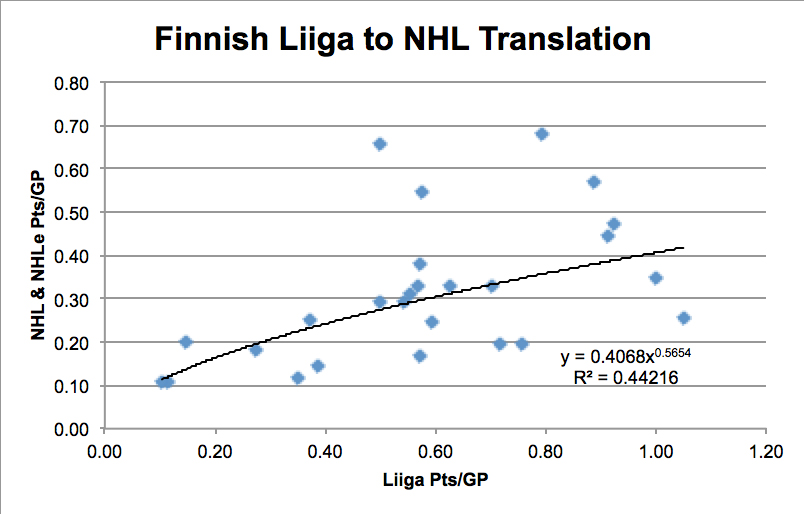
Laine and Puljujarvi’s projections are even more challenging due to a significant lack of young players directly jumping from Finland to the NHL in recent years. Thus, in an effort to expand the pool of available data we can apply similar methodology by looking at shifts between the Finnish Liiga and other lower leagues.
Conveniently between 2013-14 and 2014-15 the Finnish team Jokerit Helsinki shifted from the Liiga to the KHL, taking a large chunk of their roster with them. So we can use that data, and translate KHL points to NHL points at a value of 80 per cent. Similarly, we can look at Liiga players who have gone to the AHL and translate those points at the rate of approximately 66 per cent for young skaters (under 23) who are still developing into NHLers. This gives us the data used in the graph plotted below, with the upper two points representing Colorado prospect Mikko Rantanen (0.50 pts/gp in Liiga vs. 0.66 NHL pts/gp mainly recorded in the AHL) and Jussi Jokinen (0.79 pts/gp in Liiga vs 0.68 NHL pts/gp).

In order to account for the continual development of younger players this chart also includes playoff games and point production for the younger skaters’ final Liiga season, thus we will factor in the post-season performances of both Laine and Puljujarvi, which were exceptional.
| Player | NLA/Liiga GP | Goals | Assists | Pts | Pts/gp | Projected NHL pts/gp |
|---|---|---|---|---|---|---|
| Auston Matthews | 44 | 28 | 28 | 56 | 1.27 | 0.51 |
| Patrik Laine | 64 | 27 | 21 | 48 | 0.75 | 0.35 |
| Jesse Puljujarvi | 60 | 17 | 20 | 37 | 0.62 | 0.31 |
While both Laine’s and Puljujarvi’s projections likely feel low to outside observers on the basis of their performance at international tournaments, it should be noted where 0.30 – 0.35 points per game would fall compared to recent rookie seasons for forwards under 20 years of age. Some notable names include Evander Kane (0.39 pts/gp), Bo Horvat (0.37), Elias Lindholm (0.36), Sean Couturier (0.35), Milan Lucic (0.35), Ryan O’Reilly (0.32), Ryan Johansen (0.31) and Tyler Seguin (0.30).
THE LESSON
All three of these top prospects look like future elite NHL forwards, but projecting Matthews as a replicant of Jack Eichel or Patrik Laine as the next Alex Ovechkin is getting a big ahead of ourselves as far as what their rookie seasons should be.
That being said, both skaters grew stronger as the season progressed and both will be participating at the World Cup of Hockey before the NHL season begins. We may need to revisit expectations if they can sustain their recent string of point-per-game production in international tournaments against the top competition the world has to offer.


